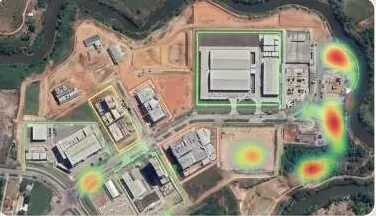
Every layer, every date, in one panel your team can use.
Web GIS dashboards that join AI detections, terrain, survey and progress data for executives and field teams.
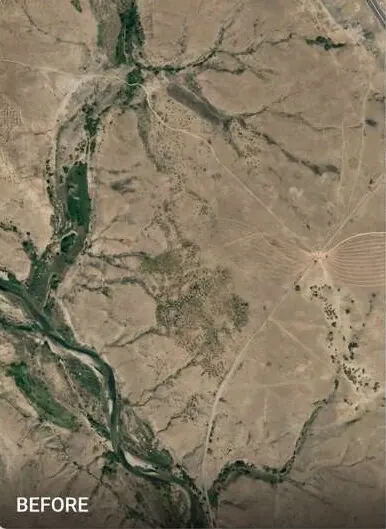
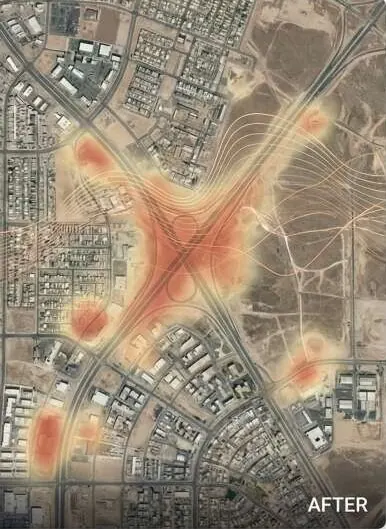
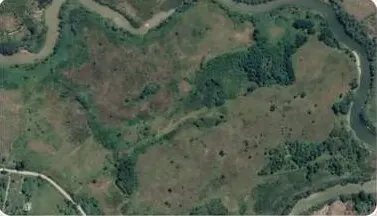
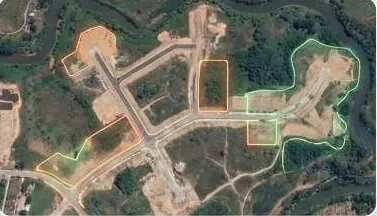
Switch the map layers.
A sample dashboard with headline figures, a trend line, a bar chart and switchable map layers. All numbers are sample data.
Questions it answers
Where are we this week, across all sites?
Which detections still need action?
Can the director see it without GIS software?
Who changed what, and when?
What you receive
Files you can open in your own GIS or CAD software, plus a report that states method and dates.
- Live dashboard link with access control
- Layer toggles: detections, terrain, survey, progress
- KPI panels and exports
- Handover training for your team
How it works
Part of Intelligent Decision Dashboards
- 1
Define decisions
We start from the questions the panel must answer, not the data.
- 2
Join the data
Survey, imagery, AI and engineering layers are structured into one store.
- 3
Build the panel
Maps, KPIs and filters, tested with the people who will use them.
- 4
Keep it current
New epochs and detections update the panel on schedule.
Who uses it
 Real Estate & HousingProve every plot to buyers and approving authorities.
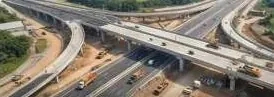 Construction & InfrastructureSettle quantities and progress with survey-grade volumes.
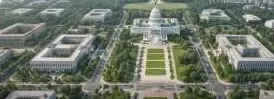 Government & Public SectorDistrict-wide imagery, terrain and change alerts.
 Urban Planning AuthoritiesCatch illegal layouts before they are sold.
 Industrial Zones & SEZsVerified levels, drainage and progress per phase.
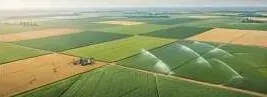 Agriculture & IrrigationLevel fields, trace water, read crop health.
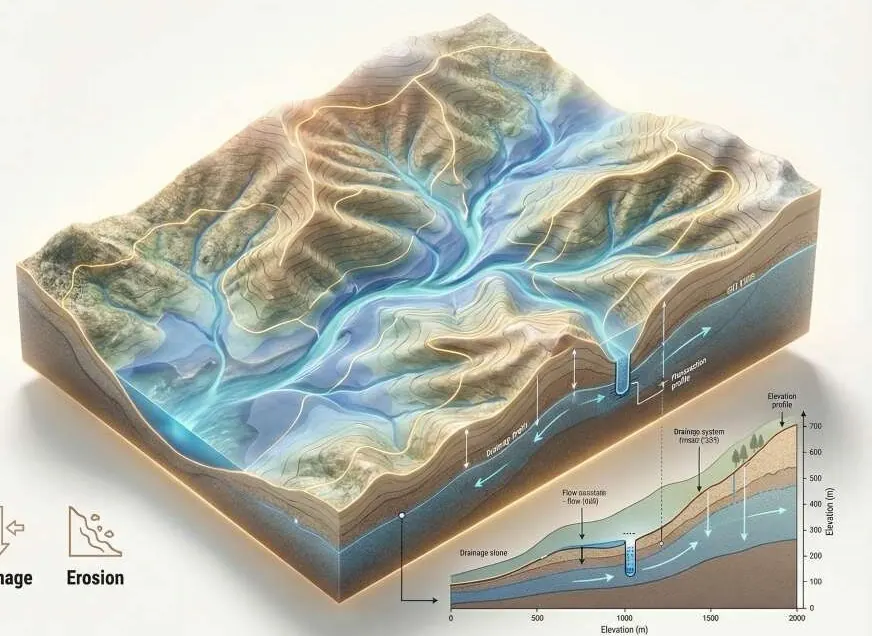 Environment, Floods & ClimateFlood hazard and damage maps engineers can check.
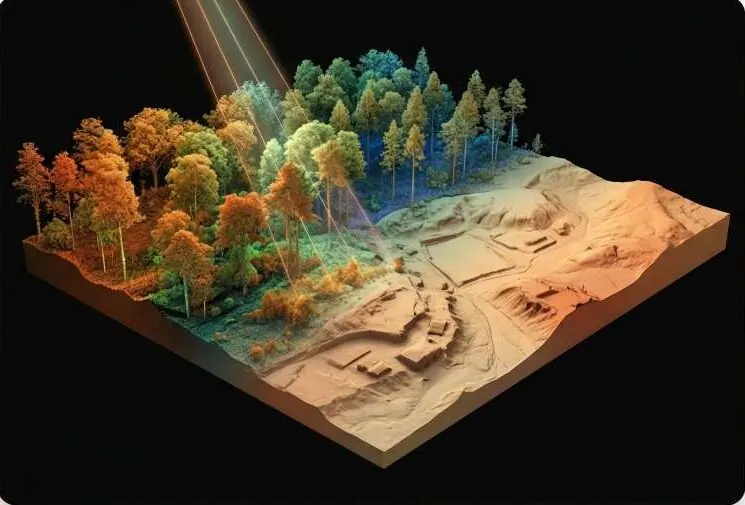 Mining, Energy & UtilitiesDefensible volumes and corridor profiles.
 Investors, Banks & Due DiligenceVerify the land before you fund it.
 Survey & Engineering FirmsAdd GeoAI, LiDAR processing and twins to your bids.
Works with
Put dashboards to work on your site.
A KML, a sketch on a map or a district name is enough to start.
We reply by email with questions, a method and a delivery list.