
District-wide imagery, terrain and change alerts in one dashboard your department can run.
What keeps you up at night
The problems we are asked to solve most often in government.
- 01
Survey data is scattered across departments.There is no single source.
- 02
Land-use and encroachment enforcement runs without current imagery.
- 03
Disaster response needs current terrain and damage maps, fast.
- 04
Infrastructure budgets are set without reliable volume or drainage data.
- 05
Procurement wants verifiable outputs and stated accuracy.
- 06
Reports go stale before they reach a decision-maker.
What we do about it
6 capabilities, one team, one coordinate system from field to dashboard.
- GeoAI & Satellite IntelligenceSatellite analysis and land-use classification.Know what changed on your land, and where, without sending a team.
- Change Detection & MonitoringIllegal construction and environmental degradation.See every new structure, cut and encroachment between two dates.
- Watershed & Hydrological EngineeringFlood risk for every district.Know where water goes before you build in its way.
- Drone Survey OperationsCurrent base maps on demand.A current, measurable picture of your site, flown on your schedule.
- LiDAR & 3D ScanningBare-earth terrain for planning.The ground under the trees, measured.
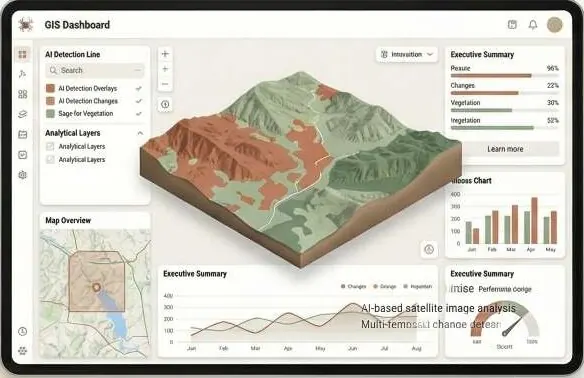
- Intelligent GIS DashboardsAn executive panel with every layer.Every layer, every date, in one panel your team can use.
Dashboards, on your ground.
Layered map with a toggle per department layer (land use, encroachment flags, flood zones); tap a flag for before / after imagery.
What lands on your desk
Files you can open, check and forward. Each delivery states its method and measured accuracy.
- District-level change detection reportPDF
- Land-use classification rasterGeoTIFFLAZ
- DTM / DEM for planningGeoTIFFDEMPDF
- Flood hazard overlayGPKG
- GIS dashboard with layersGPKGURL
- QA report with accuracy classLAZPDF
The numbers
Published figures, each with its source and date. Estimates are marked.
33 million
people affected by the 2022 floods
Government of Pakistan estimate, September 2022.
Sep 2022ReliefWeb · Pakistan floods fact sheet (opens in a new tab)
~1,700
deaths in the 2022 floods
NDMA figures cited in the IFRC final report, as of November 2022.
Nov 2022IFRC · Pakistan Monsoon Floods final report (opens in a new tab)
46 million+
land parcels in Punjab's computerised records
Sources put rural records at about 96–98% digitised, for about 55 million landowners. The records exist; they are not joined to terrain or imagery.
2026Express Tribune · INP WealthPK (opens in a new tab)Second source (opens in a new tab)
Send us a boundary. We'll send back intelligence.
A KML, a sketch on a map or a district name is enough to start.
We reply by email with questions, a method and a delivery list.